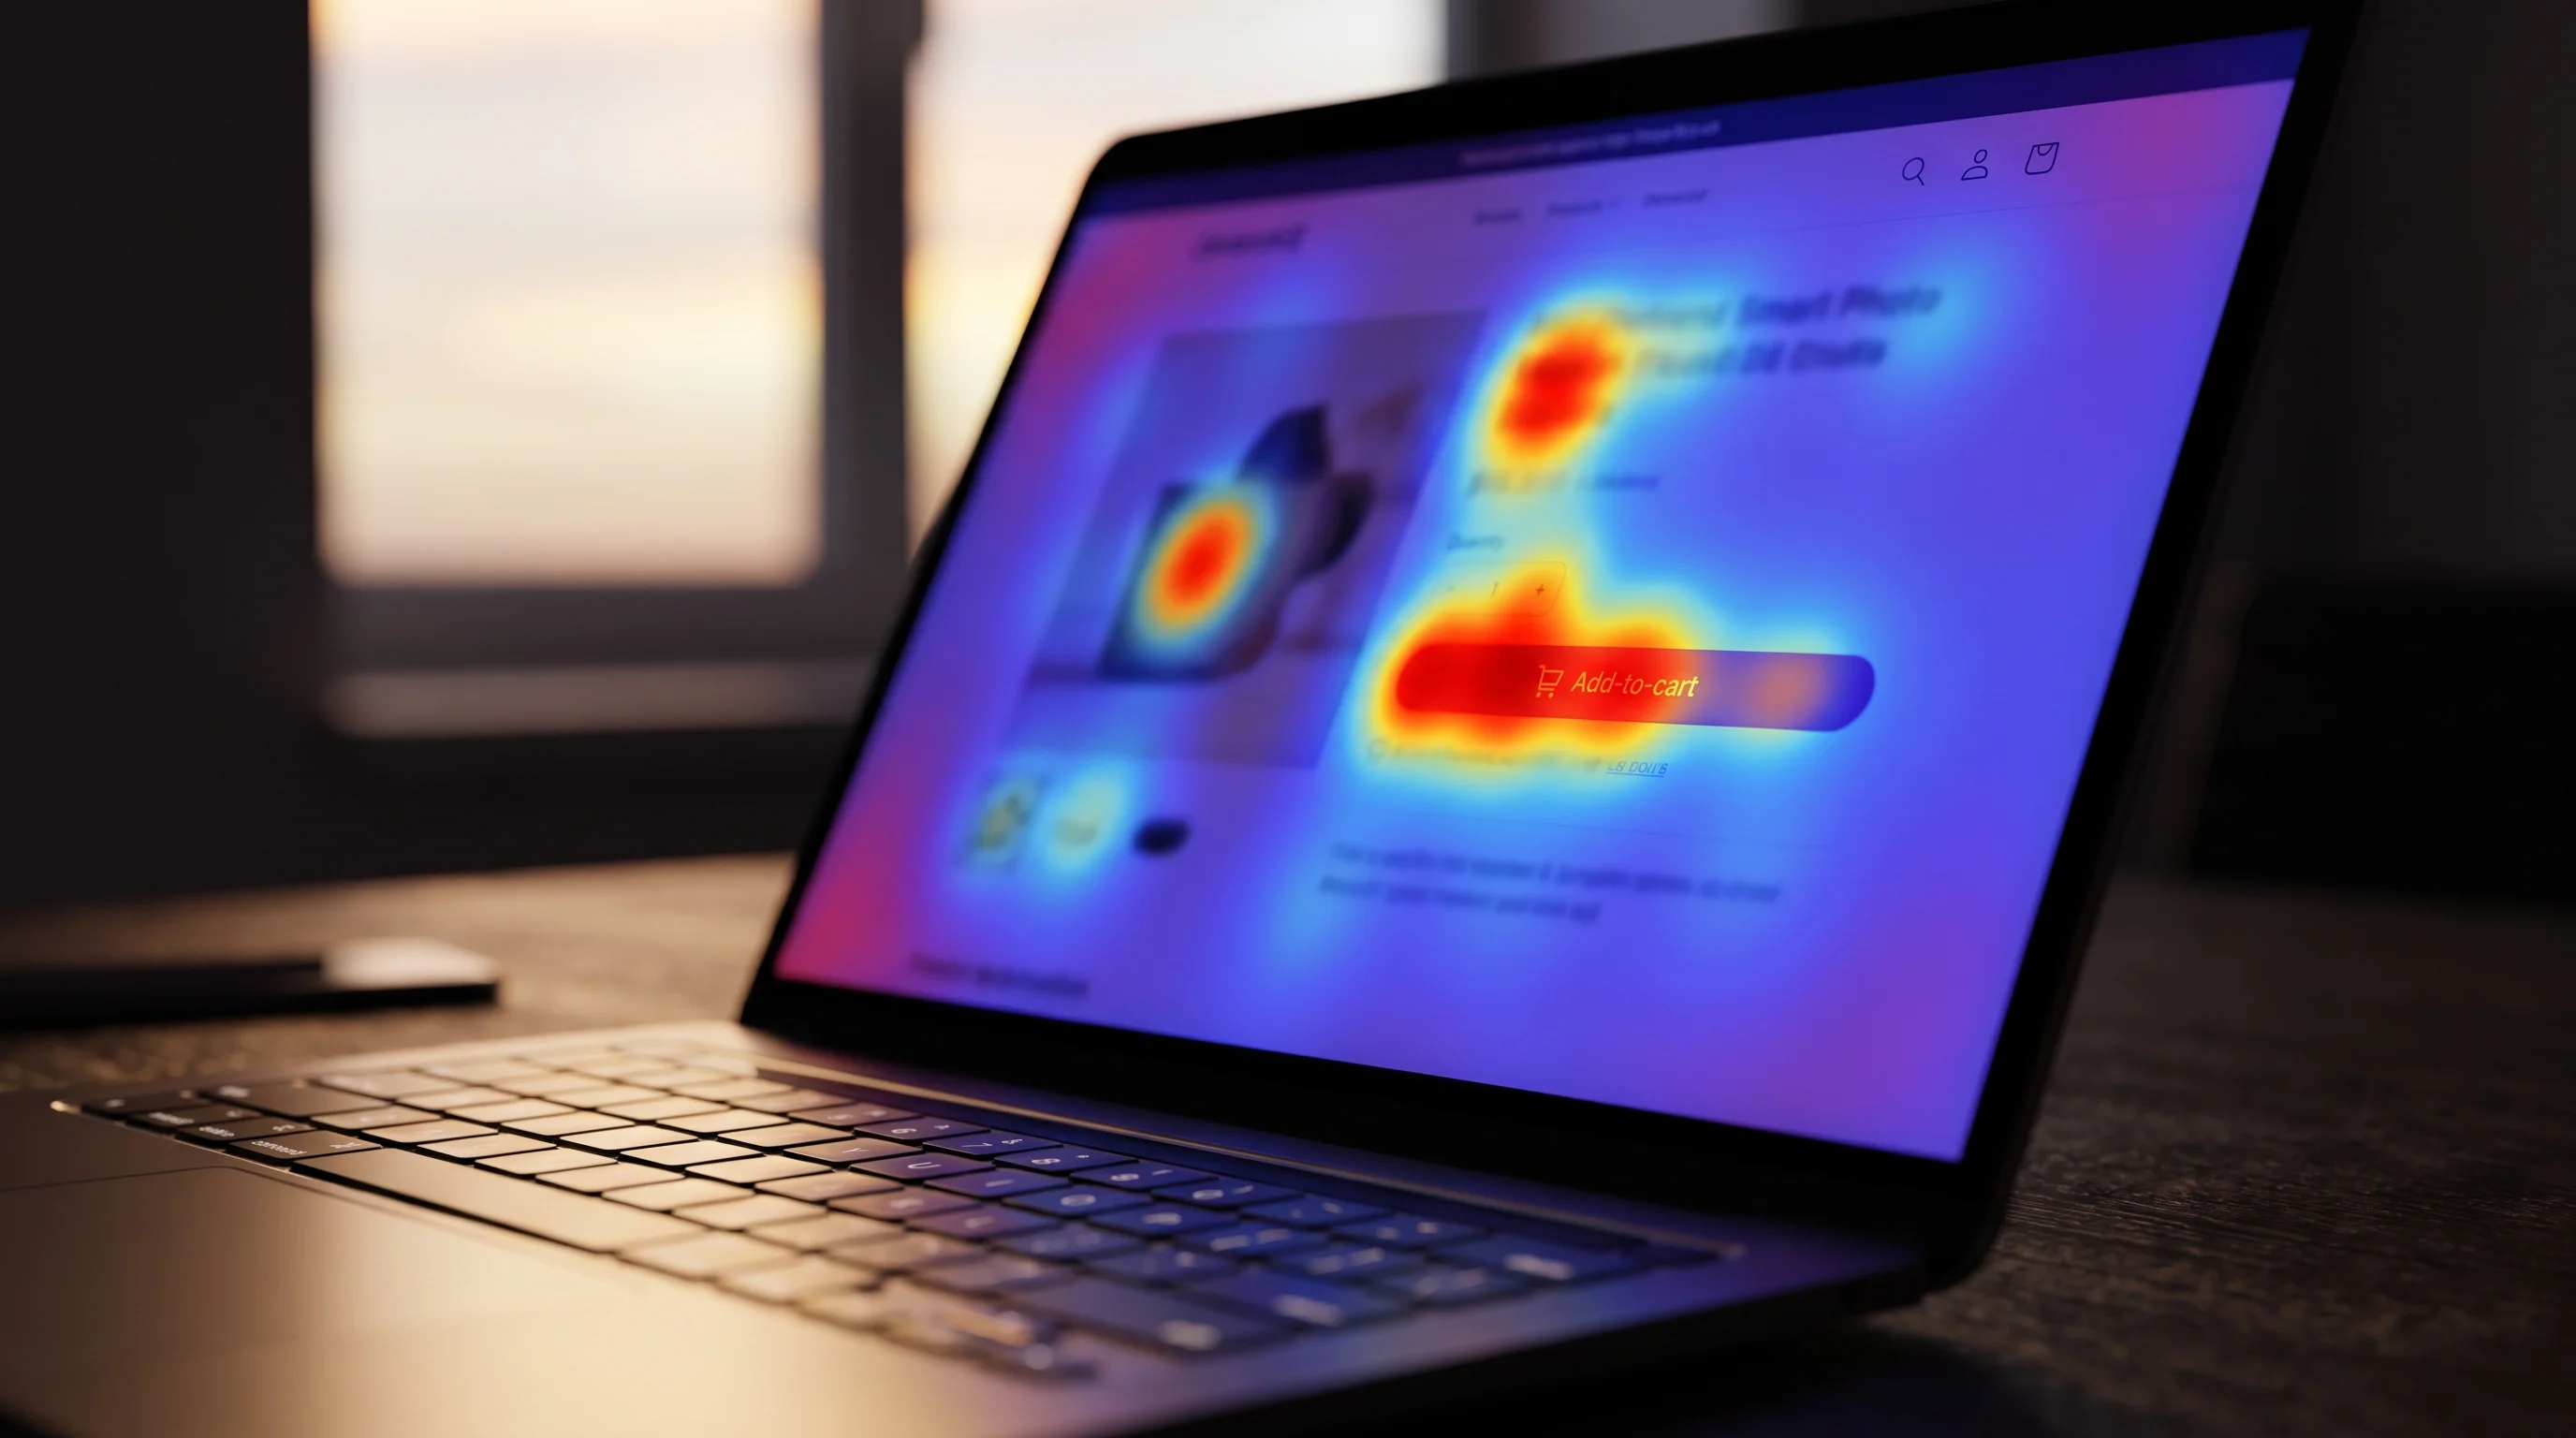
A heatmap on a product page showed a wide, deep-red zone glowing across the hero image. The team read it as proof shoppers loved the photography and added two more lifestyle shots further down the page. The next month's conversion rate did not move. The "hot zone" was not interest. It was a lazy-loaded image shifting layout mid-scroll, catching every cursor that happened to be passing through on the way to the size selector below it.
That is the recurring failure mode in ecommerce heatmap analysis: treating a color as a conclusion. A heatmap, a scroll map, and a session recording are all observational tools. They show what shoppers did. They do not, on their own, tell you why, and reading them like they do is how a CRO audit chases a fix that was never the actual problem.
- A hot click zone measures attention, not intent. Banner blindness, lazy-loaded layout shifts, and visual elements that merely look clickable all generate false heat.
- Scroll maps need a device split before they mean anything. A mobile-heavy page will always show a shorter average fold than a desktop one, with nothing broken.
- Rage clicks and dead clicks are the most actionable signal in most behavior tools, because they point at something that is actively failing, not just unpopular.
- A heatmap finding is a hypothesis. It gets confirmed against funnel data, not acted on alone.
Why most ecommerce heatmap analysis gets the diagnosis backwards
The usual workflow is: open the heatmap, find the brightest or coldest zone, write a recommendation. That order skips the one question that actually matters, which is whether the zone you are looking at is measuring something real.
Click maps, scroll maps, and session recordings answer "what happened." They cannot answer "did it matter," because none of them carry a conversion outcome by default. A zone can run hot because shoppers are genuinely comparing two product options, or because a cookie banner briefly covered that part of the screen for half your mobile traffic. The pixels look identical. The cause is not.
The fix is to reverse the order: start from a funnel number you already trust, such as a drop-off between product view and add-to-cart, and only then open the heatmap for that specific step to explain the number. A CRO audit is built around exactly that sequence, funnel data first, behavior data second. Heatmap first, hypothesis second is how teams end up redesigning a hero image that was never the problem.
Click maps: what the hot zone is actually telling you
Behavior-analytics platforms build click maps differently than most people assume. Microsoft Clarity's own documentation on how click maps are generated explains that clicks are tied to the page element itself, not the raw X and Y pixel position, which is why the same map still reads correctly across different screen sizes and responsive layouts. That matters because it means a hot zone is always attached to something specific, a button, an image, a swatch, and the first question for any hot zone is whether that element was supposed to be clicked at all.
Two artifacts show up constantly on ecommerce pages:
Banner blindness in the wrong direction. Nielsen Norman Group's eye-tracking research on banner blindness found that shoppers learn to ignore anything that visually resembles an advertisement, even content that directly answers their question. The inverse also happens: an element styled to look important, a bold badge, a bright "limited stock" label, draws clicks purely because it looks clickable, not because shoppers want the thing behind it.
Layout shift catching the cursor. Lazy-loaded images, late-arriving reviews widgets, and cookie banners all move content after the page first paints. A click map aggregated across sessions cannot tell the difference between "the shopper meant to click there" and "something moved under their cursor right before they clicked."
Scroll maps: the fold is not a wall, but it still matters
Scroll maps show the percentage of visitors reaching each depth of a page and calculate what Clarity calls the average fold, the point most visitors can see before they start scrolling. The instinct is to treat the fold as a hard cutoff and cram everything important above it. That instinct is outdated advice from a desktop-only internet, and on its own it says nothing about mobile shoppers, who make up most ecommerce traffic and see a shorter fold by default.
The real trap is reading one scroll map for a page that gets both desktop and mobile traffic. A mobile viewport is shorter, so the average fold sits higher up the page by definition, which makes a perfectly fine mobile layout look like it is failing when compared against a desktop benchmark, and vice versa. Split every scroll map by device before drawing a single conclusion from it. A page that looks like it is losing shoppers at 40% scroll depth blended across devices might be converting mobile shoppers at 70% scroll depth and desktop shoppers at 25%, two different stories hiding inside one average.
Rage clicks and dead clicks: the signal most teams skip past
If a heatmap has one category worth checking before anything else, it is rage clicks and dead clicks, not the standard click map. Contentsquare's guide to rage click maps describes a rage click as repeated clicks or taps on the same element in rapid succession, a pattern that signals the shopper expected a response and got nothing. Microsoft Clarity's heatmap documentation lists rage clicks and dead clicks as their own dedicated map types specifically because they isolate broken interactions rather than popularity.
The reason this matters more than a standard click map: a rage click cannot be explained away as a design preference or a banner-blindness artifact. Something on the page is not responding the way the shopper expects. Common ecommerce causes are a size or color swatch that visually looks selectable but needs a second click to register, an add-to-cart button with no loading state so shoppers click it again assuming it failed, and accordion sections on mobile that require a precise tap target smaller than a thumb.
Pull the session recordings behind any rage-click cluster before writing a fix. The recording usually shows the exact misfire in under thirty seconds, which a click count alone cannot.
Watching session recordings without losing an afternoon
Session recordings are the only tool in this set that answer "why," and they are also the easiest to waste time on. Watching fifty recordings chosen at random mostly confirms that shoppers browse normally most of the time, which is not useful.
The better method is to filter first, watch second:
- Filter recordings to the specific segment tied to the funnel drop-off you are investigating, for example mobile sessions that reached checkout but did not complete it, not all sessions on the site.
- Watch 15 to 20 recordings in that segment, not fifty. Past that number, new recordings mostly repeat patterns you have already seen.
- Go in with one question, such as "where exactly does the shopper hesitate on the shipping step," rather than watching passively for anything interesting.
- Note the specific element or moment where a pattern repeats across multiple recordings. One odd session is an outlier. Six sessions hesitating at the same form field is a finding.
This is the same discipline that separates a fixed-scope CRO audit that produces a ranked, evidence-backed fix list from a highlight reel of mildly interesting shopper behavior. Stores that find this kind of leak every quarter, not just once, tend to move to ongoing conversion rate optimization instead of re-scoping a new audit each time.
Cross-checking a heatmap finding before you act on it
None of this replaces analytics. It layers on top of it. A real CRO audit runs the funnel numbers first, a measurement-first conversion rate optimization audit checklist exists for exactly this reason, and only opens heatmaps and recordings for the specific step the numbers already flagged as a leak. Choosing which behavior tool to run that check with, Clarity, Hotjar, or one of the heavier platforms, is a separate decision covered in our breakdown of conversion optimization tools for ecommerce, but the tool choice matters far less than the order of operations.
A heatmap that confirms a funnel number is evidence. A heatmap read in isolation is a guess with better graphics.
A checklist before you trust a heatmap finding
Run through this before a heatmap or session-recording insight goes into a fix list:
- Is the sample big enough to trust the color? A quiet page and a busy page can render the same intensity with very different click counts behind them.
- Did you split by device? Scroll depth, fold position, and even which elements are visible at all change between mobile and desktop.
- Is the hot zone followed by the next funnel step? Check clicks against the actual event data, not just the warmth of the map.
- Would a rage or dead click explain it better than a popularity story? Broken interactions produce heat too, and they are usually more fixable than a vague design preference.
- Have you watched the recordings behind the number, not just the aggregate map? The map tells you where. The recording tells you why.
A heatmap that survives this list is worth building a fix around. One that does not is worth a second look before it reaches a sprint board, and if the funnel data behind it is not trustworthy in the first place, that is the gap worth closing before any heatmap gets opened at all.