

Every ecommerce brand I have worked with has the same problem at different scales. Facebook reports one number, Google reports another, Shopify disagrees with both, and the CFO pulls a third number out of a spreadsheet that nobody can fully reconstruct. When growth is slow, everyone blames attribution. When growth is fast, nobody looks under the hood until stock runs out.
The fix is not a better dashboard. It is a honest data stack - one place where ad spend, funnel behaviour, checkout behaviour, transactions, customers, and inventory all land with matching definitions. Dashboards are downstream of that. So are Slack alerts. So is the inventory supply plan.
This post walks through the stack I build for ecommerce brands running real ad spend across Meta, Google, TikTok, Taboola, YouTube, and AppLovin, with Funnelish landing pages, Checkout Champ for checkout, and Shopify as the store of record. It is the same stack whether you are doing fifty thousand a month or five million.
The architecture in one picture
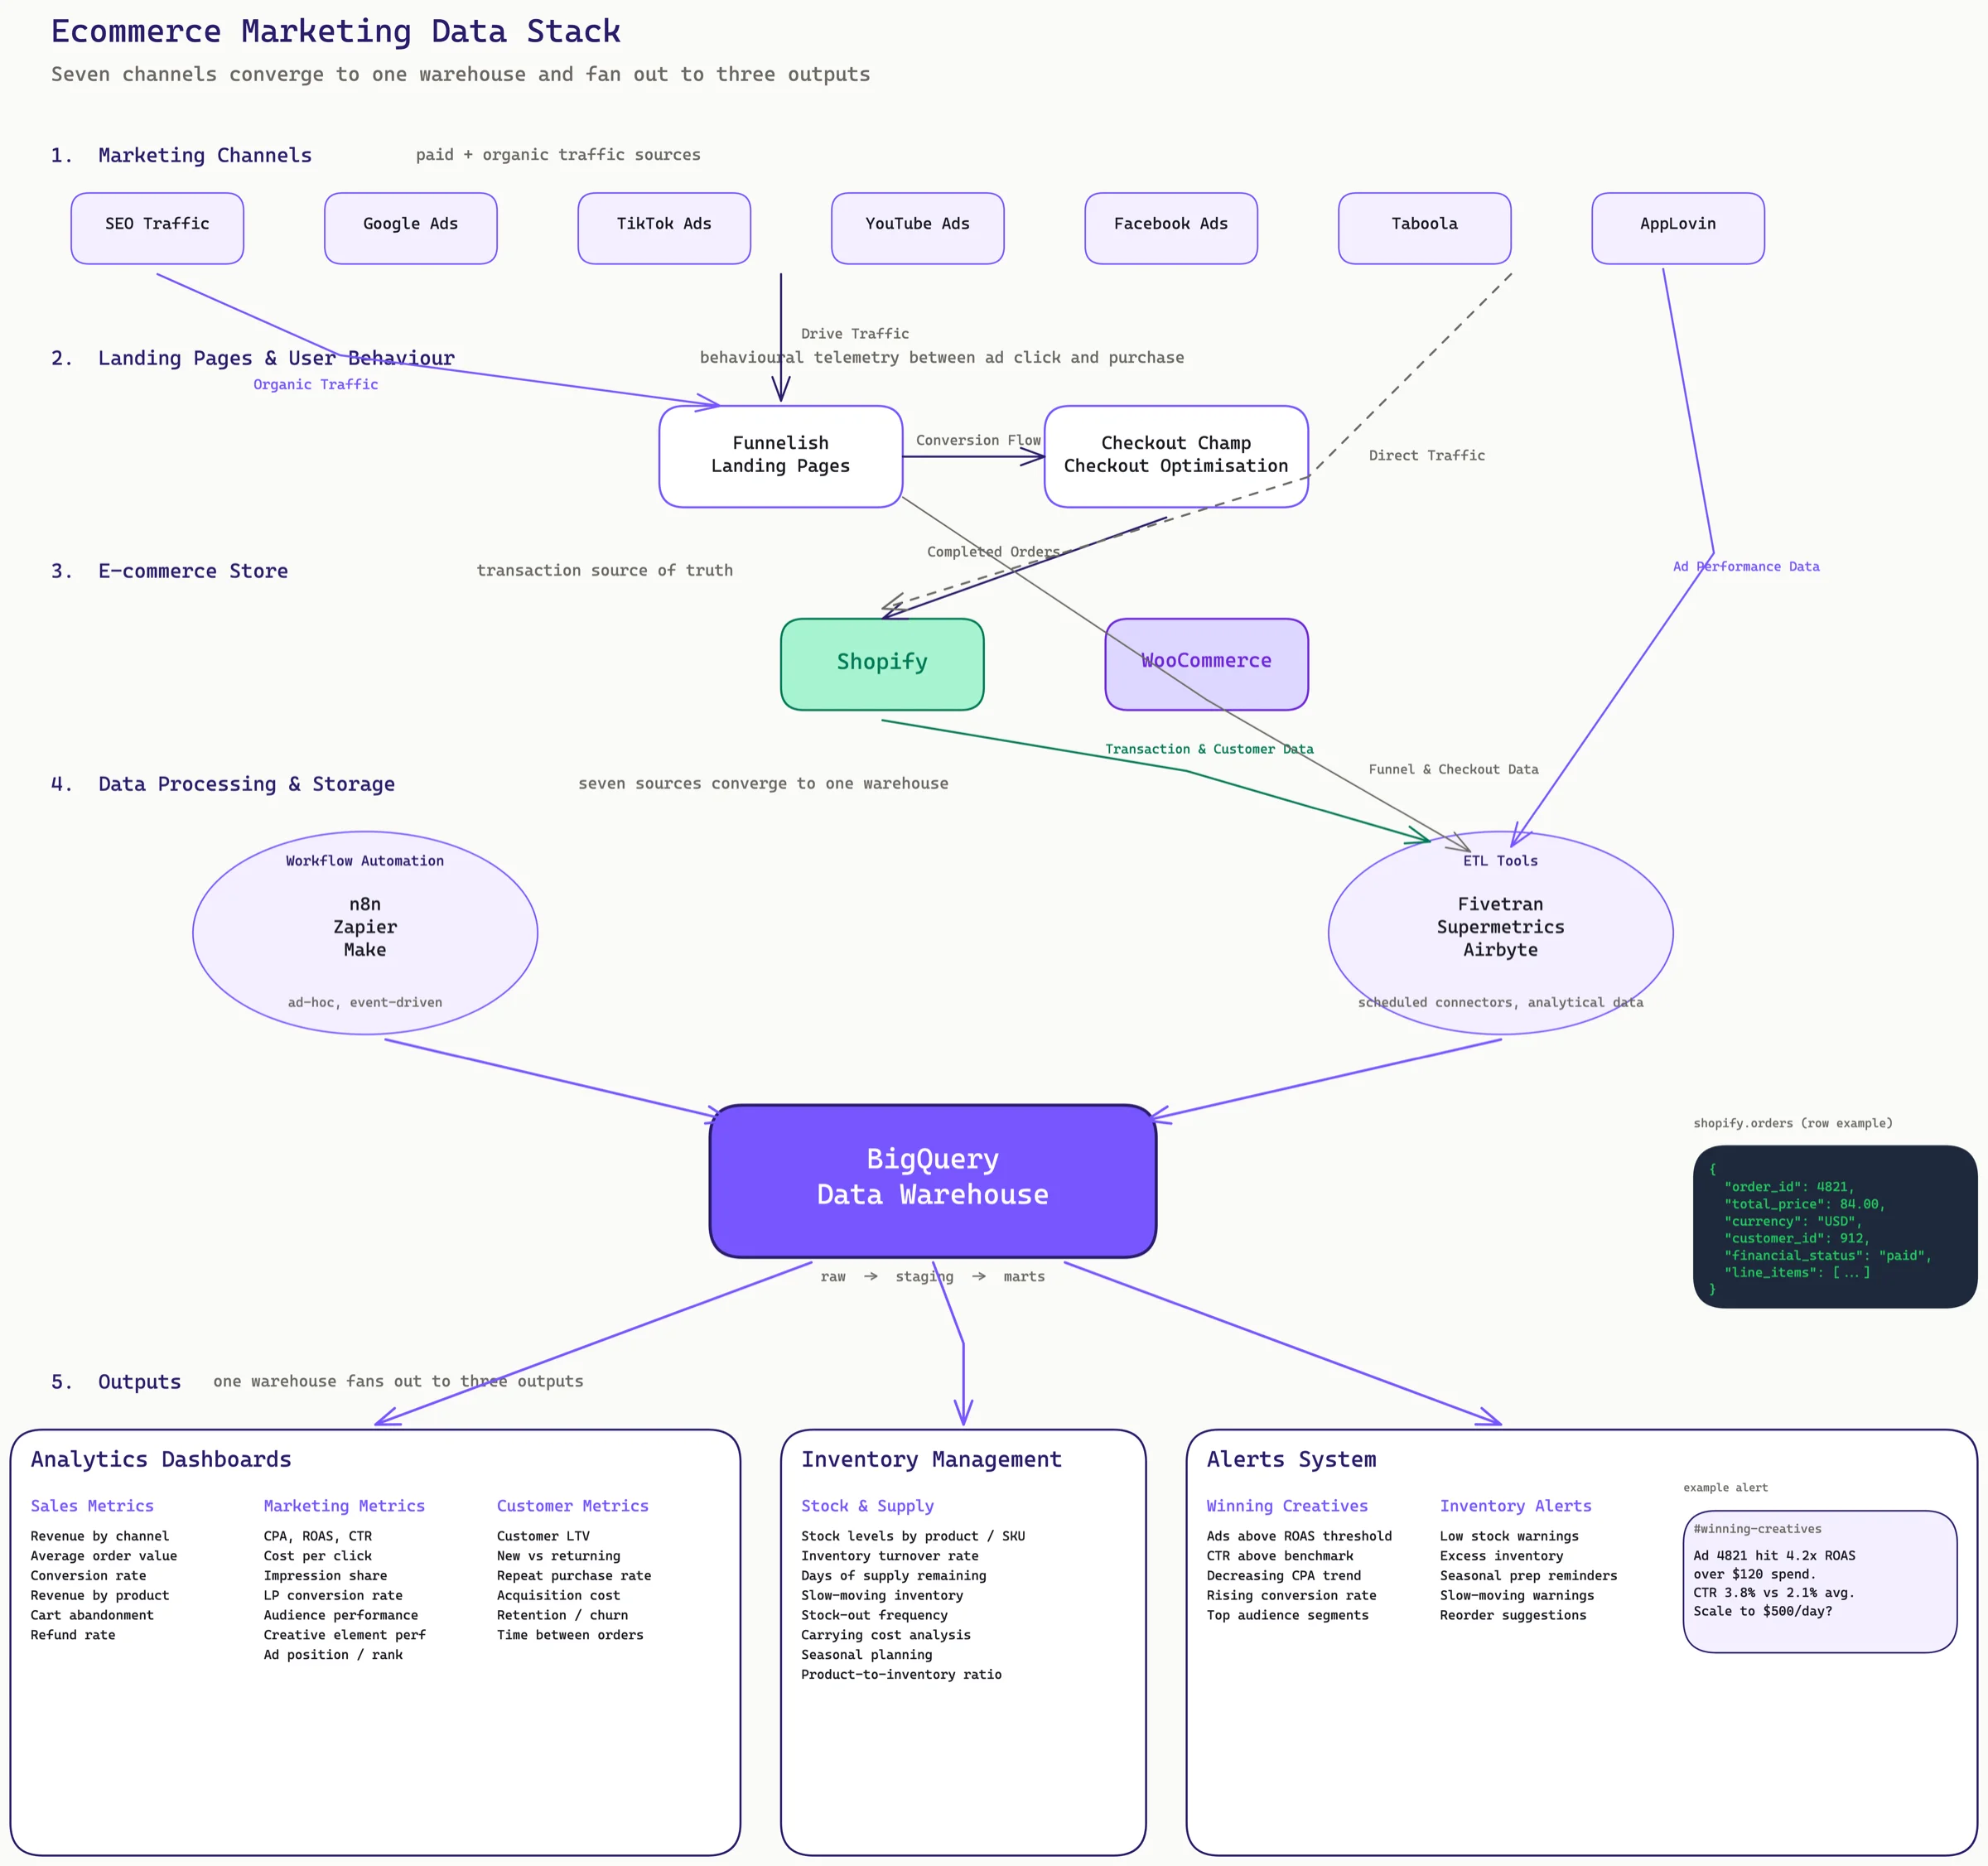
Read it top to bottom:
- Paid and organic channels drive traffic
- Funnelish catches it on landing pages, Checkout Champ converts it
- Shopify records the transaction
- ETL tools pull all of that into BigQuery
- BigQuery feeds dashboards, inventory management, and alerts
Every arrow on that diagram is a decision. The rest of this post explains what goes into each box, what breaks most often, and what I do about it.
1. Marketing channels: seven sources, one definition
A scaled ecommerce brand typically runs:
- Meta / Facebook / Instagram Ads - campaign, adset, ad, and creative-element tracking
- Google Ads - search and display, with offline conversion imports
- TikTok Ads - campaign and creative performance, creative testing frameworks
- YouTube Ads - video campaign performance, often via Google Ads
- Taboola - native, with daily and monthly P&L tracking
- AppLovin - mobile and CTV, ROAS-focused with custom KPI definitions
- SEO - organic traffic, blended with paid attribution
The first problem is that each platform counts differently. Meta does 7-day click, 1-day view by default. Google does last-click across its network. TikTok has its own attribution window. ROAS on Taboola is not comparable to ROAS on Meta unless you normalize.
The definition that survives across channels is usually: purchase event, last-click on last-touch platform, seven-day window, deduplicated at the order_id level using Shopify as the source of truth. Everything else is a reconciliation view, not the base number.
2. Landing pages and user behaviour
Funnelish sits between the ad click and Shopify. It hosts the landing page, catches the intent, and hands off to checkout. Most brands do not realise Funnelish emits a lot of behavioural data that never makes it into their warehouse - add-to-cart, upsell views, upsell accepts, post-purchase offers.
Checkout Champ does the same for checkout itself. Checkout abandonment, field-level dropoff, A/B test variant, payment method. This is the richest telemetry in the entire funnel and it is usually the most ignored.
If you only look at Shopify, you miss the reason your conversion rate dropped. It might be a broken upsell, a payment gateway outage, or a specific offer that tanks only on iOS. None of that shows up in GA4.
The rule I apply:
- Funnelish data goes into the warehouse as its own schema:
funnelish.page_views,funnelish.adds_to_cart,funnelish.upsell_events - Checkout Champ data goes in as
checkout.sessions,checkout.field_events,checkout.payment_attempts - Shopify is the transaction source of truth:
shopify.orders,shopify.customers,shopify.products
These are three sources, not one, and they do not trust each other. The warehouse stitches them with a deterministic session ID passed through the URL and the order_id when checkout completes. Without that stitch, funnel-level insight is impossible.
3. Ecommerce store: Shopify and WooCommerce
Shopify is the simpler side. Shopify's API is mature, Fivetran has a connector, and the schema maps cleanly onto a warehouse. The things that go wrong are predictable:
- Timezones. Shopify records in the store's timezone, ad platforms record in their own, and BigQuery stores in UTC. Every query that joins Shopify orders to ad spend has to convert both to UTC explicitly. This is the single most common source of "why does yesterday look weird" bugs.
- Refunds and partial refunds. A naive
SUM(total_price)overstates revenue by 3-8 percent on most brands because refunds come in on a later date. UseSUM(total_price) - SUM(total_refunded)and date-align the refunds. - Test orders and bot orders. Filter by
financial_status = 'paid'andtest = falseor you will be reporting on QA traffic.
WooCommerce adds the complication that the schema is a WordPress database, not a clean ecommerce one. The orders, products, and customers are stored as WordPress posts with meta tables. Fivetran and Airbyte both handle it, but the models are more work than Shopify. Plan for it.
4. Data processing and storage
This is where the stack actually lives. Three layers:
Workflow automation
n8n, Zapier, and Make handle the ad-hoc integrations. A Slack notification when an order over a threshold comes in. A webhook that posts new Shopify orders to a Google Sheet for the finance team. An automation that tags customers in Klaviyo based on purchase patterns.
Do not confuse this layer with ETL. Workflow tools are for small, event-driven side-channels. They should never be the primary path for analytical data. They break silently and are impossible to backfill.
ETL tools
Fivetran, Supermetrics, and Airbyte pull the marketing and ecommerce data into BigQuery on a schedule.
- Fivetran for the major platforms: Meta Ads, Google Ads, Shopify, HubSpot, Klaviyo. Reliable, expensive, low maintenance.
- Supermetrics for the long tail: Taboola, AppLovin, TikTok, Pinterest. Cheaper per connector, more flexibility, more occasional failures.
- Airbyte for self-hosted and custom sources. Funnelish and Checkout Champ often do not have managed connectors, so we build on Airbyte or write a direct API connector that dumps to Cloud Storage and loads to BigQuery.
The boring answer is: use Fivetran for the platforms that justify the cost, Supermetrics for mid-tier, Airbyte or custom for everything else.
BigQuery as the warehouse
BigQuery is the neutral ground. Every channel lands here, every dashboard reads from here, every alert fires from here. Two reasons I default to BigQuery over Snowflake or Redshift for ecommerce:
- Native integration with Google Ads (data transfer service) and GA4 (one-click export)
- Per-query pricing that forgives small brands running ten queries a day
The warehouse has three conceptual layers:
- Raw - exactly what Fivetran and friends dump in, no transformations
- Staging - cleaned, typed, timezone-normalized, deduplicated
- Marts - business-facing tables:
mart_daily_channel_performance,mart_creative_performance,mart_inventory_position
Every dashboard reads from marts. Every ad-hoc query reads from staging. Nobody reads from raw except the data engineer debugging a connector.
5. Analytics dashboards
With the warehouse in place, dashboards become easy. The ones I ship on every project:
Whole business P&L
One page, updated daily. Columns: channel, spend, revenue, margin, contribution, blended ROAS, profit. This is the dashboard the founder opens first thing in the morning. If this takes longer than two seconds to load or requires interpretation, it is failing at its job.
Cross-channel ROAS
By day, by week, by month, with platform-reported vs warehouse-reported side by side. The gap between these two numbers is one of the most important metrics in the whole stack. When they diverge, something broke.
Platform-specific deep dives
One tab per major channel. Meta gets the most detail because that is where most of the creative work happens: campaign > adset > ad, plus creative-element breakdowns (hook, angle, editor, script, actor). Taboola gets a P&L view with margin. AppLovin gets a ROAS tracker with custom KPI thresholds. Google gets search-vs-display split and brand-vs-generic.
Creative performance framework
Every creative gets tagged with its elements: hook type, angle, script category, editor, lead actor, concept vs iteration. The dashboard then lets the creative team compare "which hook drives the lowest CPA" and "are iterations outperforming new concepts this month". This is what actually changes creative strategy, not another ROAS chart.
Customer analytics
Customer lifetime value, new vs returning ratio, repeat purchase rate, time between purchases, segmentation metrics, retention curves. Less urgent than the P&L but the thing that tells you if growth is real or if you are just buying the same customer twice.
6. Inventory management
Inventory is a marketing metric. The best ROAS in the world cannot scale if stock runs out in seven days, and carrying cost destroys margin if you overstock.
The inventory view reads from Shopify (current stock levels, sales velocity) and a supply-side source (incoming POs, lead times) to answer:
- Days of supply remaining at current velocity, per SKU
- Slow-moving inventory - SKUs below expected sell-through
- Stock-out frequency - how often we actually missed orders because we ran out
- Carrying cost - tied-up cash in inventory, by product and category
- Seasonal planning - next 90 days of expected demand by SKU
The point is not a pretty dashboard. The point is that when the media buyer asks "can we scale this creative 3x", the inventory system can answer "yes for 14 days, then you run out of XL blue". That is the conversation that moves the business.
7. Alerts and automation
Dashboards are pull. Alerts are push. The push layer is where the stack earns its keep day to day.
Daily performance summary in Slack
Every morning, a Slack post with yesterday's numbers. Spend, revenue, ROAS, profit, margin - by channel and blended. Color-coded against last week's average. The founder reads this on their phone before opening a laptop.
Winning creative alerts
Custom thresholds per country, per account. "Any ad exceeding 3x ROAS with more than 50 dollars spend and a CTR above the account benchmark" fires a Slack message with the creative preview, the performance breakdown, and a link to scale it. Nobody has to watch ads manager for this.
CPA drift alerts
The inverse of winning creative alerts. When a previously-good ad's CPA rises by more than 40 percent over its 3-day average, we fire an alert before the ad burns through another day of budget.
Inventory alerts
- Low stock - less than 30 days of supply remaining at current velocity
- Excess inventory - SKUs that have not sold in 60 days
- Seasonal prep reminders - tied to historical demand curves
- Slow-moving product warnings, by SKU and collection
The rule for alerts: if you are not going to act on it, do not alert on it. The quickest way to kill a Slack alert channel is to flood it with noise. Every alert in this system corresponds to a decision someone would actually make that day.
What it looks like when it works
A few months in, the pattern that emerges:
- Creative turnaround goes from weeks to days. The team sees a winner by 11am and it is scaled by 3pm.
- Weekly reporting goes from "how many spreadsheets did you have to rebuild" to "open the dashboard, read the first paragraph, done".
- Inventory-driven scaling conversations replace revenue-driven ones. "We can scale this 2x for 21 days before we need to airfreight" beats "we hope this keeps working".
- The gap between platform-reported and warehouse-reported ROAS becomes a known, stable gap. Everyone stops arguing about whose number is right and starts making the same decisions.
What tends to break
Every ecommerce stack I have built has hit at least three of these in the first six months:
- Currency. Multi-country brands mix revenue in the store's settle currency and ad spend in the ad account's currency. FX rates change. Plan for it - carry a FX snapshot table.
- Duplicate orders. Shopify and Checkout Champ can both emit the same order with slightly different IDs. Deduplicate on customer + timestamp + amount, not just ID.
- Creative taxonomy drift. Over time, the creative team starts making up new hook types that were never in the original taxonomy. The dashboard silently buckets them into
other. Audit the taxonomy quarterly. - Connector silent failures. Fivetran and Supermetrics both sometimes stop syncing without telling you. Monitor row counts and timestamps, not just connector status.
- Consent and privacy. iOS ATT, GDPR, and the long tail of consent platforms all reduce the data actually making it into the warehouse. Your numbers do not add up to reality. Know the gap.
Where to start
If you are building this from scratch, the order matters.
- Shopify into BigQuery via Fivetran. Get transactions right first.
- Meta and Google Ads into BigQuery. Reconcile daily spend, revenue, and ROAS against the platforms. You will find bugs here and it is better to find them with two channels than seven.
- Funnelish and Checkout Champ into BigQuery via Airbyte or custom connector.
- The long-tail channels: TikTok, Taboola, AppLovin, YouTube. One at a time.
- Staging models, marts, then the dashboards on top.
- Alerts last. Do not build alerts on top of a shaky warehouse - they will fire on bad data and train the team to ignore them.
This is a six to twelve week build for a mid-sized brand if you have a data engineer. Three to four weeks if the pipes are simple and you are disciplined about scope. We have shipped this end to end for agencies where we are the data team, and for in-house teams where we build it and hand it over.
The tools in this post are the ones I reach for most often. The tools matter less than the discipline. A stack with three channels and honest definitions beats a stack with ten channels and a different number on every dashboard.
If you are running an ecom brand and none of your weekly numbers line up, that is the problem to solve first. Everything else is downstream.
